揭秘 Actuator 的端点
Spring Boot Actuator的关键特性是在应用程序里提供众多Web端点,通过它们了解应用程序 运行时的内部状况。
有了Actuator:
- 可以知道Bean在Spring应用程序上下文里是如何组装在一 起的
- 掌握应用程序可以获取的环境属性信息
- 获取运行时度量信息的快照……
引入Actuator
引入Actuator的起步依赖:
<dependency>
	<groupId>org.springframework.boot</groupId>
	<artifactId>spring-boot-starter-actuator</artifactId>
</dependency>
Gradle构建:
compile 'org.springframework.boot:spring-boot-starter-actuator'
使用Spring Boot CLI,可以使用如下 @Grab 注解:
@Grab('spring-boot-starter-actuator')
配置信息
# Spring Actuator Endpoints 默认关闭,需要打开
endpoints.enabled=true
# close security. 关闭身份验证,否则无法查询出数据
management.security.enabled=false
Spring Boot 2.0 的Actuator只暴露了health和info端点。
可以在 application.yml 文件中加入配置暴露所有端点:
management:
  endpoints:
    web:
      exposure:
        include: "*"
Actuator的端点
| HTTP 方法 | 路径 | 描述 |
|---|---|---|
| GET | /auditevents | 显示应用暴露的审计事件 (比如认证进入、订单失败) |
| GET | /beans | 描述应用程序上下文里全部的 Bean,以及它们的关系 |
| GET | /conditions | 提供一份自动配置生效的条件情况,记录哪些自动配置条件通过了 |
| GET | /configprops | 描述配置属性(包含默认值)如何注入Bean |
| GET | /env | 获取全部环境属性 |
| GET | /env/{name} | 根据名称获取特定的环境属性值 |
| GET | /flyway | 提供一份 Flyway 数据库迁移信息 |
| GET | /liquidbase | 显示Liquibase 数据库迁移的纤细信息 |
| GET | /health | 报告应用程序的健康指标,这些值由 HealthIndicator 的实现类提供 |
| GET | /heapdump | dump 一份应用的 JVM 堆信息 |
| GET | /httptrace | 显示HTTP足迹,最近100个HTTP request/repsponse |
| GET | /info | 获取应用程序的定制信息,这些信息由info打头的属性提供 |
| GET | /logfile | 返回log file中的内容(如果 logging.file 或者 logging.path 被设置) |
| GET | /loggers | 显示和修改配置的loggers |
| GET | /metrics | 报告各种应用程序度量信息,比如内存用量和HTTP请求计数 |
| GET | /metrics/{name} | 报告指定名称的应用程序度量值 |
| GET | /scheduledtasks | 展示应用中的定时任务信息 |
| GET | /sessions | 如果我们使用了 Spring Session 展示应用中的 HTTP sessions 信息 |
| POST | /shutdown | 关闭应用程序,要求endpoints.shutdown.enabled设置为true |
| GET | /mappings | 描述全部的 URI路径,以及它们和控制器(包含Actuator端点)的映射关系 |
| GET | /threaddump | 获取线程活动的快照 |
查看配置明细
Actuator有一些端点不仅可以显示组件映射关系,还可以告诉你自动配置在配置 Spring应用程序上下文时做了哪些决策。
获得Bean装配报告:/beans
要了解应用程序中Spring上下文的情况,最重要的端点就是/beans:http://localhost:8080/beans。
它会返回一个JSON文档, 描述上下文里每个Bean的情况,包括其Java类型以及注入的其他Bean。
所有的Bean条目都有五类信息:
- bean :Spring应用程序上下文中的Bean名称或ID。
- resource :.class文件的物理位置,通常是一个URL,指向构建出的JAR文件。这会随着 应用程序的构建和运行方式发生变化。
- dependencies :当前Bean注入的Bean ID列表。
- scope :Bean的作用域(通常是单例,这也是默认作用域)。
- type :Bean的Java类型。
详解自动配置:/autoconfig
/autoconfig 端点能告诉为什么会有这个Bean,或者为什么没有这个Bean。
/autoconfig 端点提供了
一个报告,列出了计算过的所有条件,根据条件是否通过进行分组。
- 在 positiveMatches 里,你会看到一个条件,决定Spring Boot是否自动配置 Bean。
- 在 negativeMatches 里,有一个条件决定了是否要配置 Bean。
查看配置属性:/env
/env 端点会生成应用程序可用的所有环境属性的列表,无论这些属性是否用到。
这其中包括 环境变量、JVM属性、命令行参数,以及applicaition.properties或application.yml文件提供的属性。
/env端点还能用来获取单个属性的值,只需要在请求时在/env后加上属性名即可。
$ curl 'http://localhost:8080/env/local.server.port'
{"local.server.port":8080}
生成端点到控制器的映射:/mappings
/mappings 端点就提供了一个列表,罗列出了应用程序发布的全部端点。
运行时度量
Actuator 提供了一系列端点,让你能在运行时快速检查应用程序。
查看应用程序的度量值:/metrics
/metrics端点提供了很多信息:
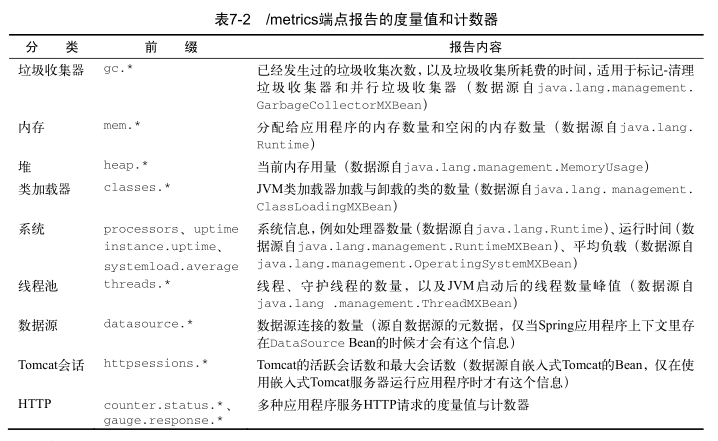
/metrics端点会返回所有的可用度量值。要获取单个值,请 求时可以在URL后加上对应的键名。
# 查看空闲内存大小
$ curl 'http://localhost:8080/metrics/mem.free'
{"mem.free":526667}
追踪Web请求:/trace
/trace端点能报告所有Web请求的详细信息,包括请求方法、路径、时间戳以及请求和响应的头信息。
/trace端点实际能显示最近100个请求的信息,包 含对/trace自己的请求。
{
    "timestamp": 1562555495073,
    "info": {
        "method": "GET",
        "path": "/metrics/mem.free",
        "headers": {
            "request": {
                "host": "localhost:8080",
                "connection": "keep-alive",
                "upgrade-insecure-requests": "1",
                "user-agent": "Mozilla/5.0 (Windows NT 10.0; Win64; x64) AppleWebKit/537.36 (KHTML, like Gecko) Chrome/75.0.3770.100 Safari/537.36",
                "accept": "text/html,application/xhtml+xml,application/xml;q=0.9,image/webp,image/apng,*/*;q=0.8,application/signed-exchange;v=b3",
                "accept-encoding": "gzip, deflate, br",
                "accept-language": "zh-CN,zh;q=0.9,zh-HK;q=0.8,zh-TW;q=0.7,en;q=0.6"
            },
            "response": {
                "X-Application-Context": "application:development",
                "Content-Disposition": "inline;filename=f.txt",
                "Content-Type": "application/vnd.spring-boot.actuator.v1+json;charset=UTF-8",
                "Transfer-Encoding": "chunked",
                "Date": "Mon, 08 Jul 2019 03:11:35 GMT",
                "status": "200"
            }
        },
        "timeTaken": "17"
    }
}
导出线程活动:/dump
/dump端点会生成当前线程活动的快照。 完整的线程导出报告里会包含应用程序的每个线程。
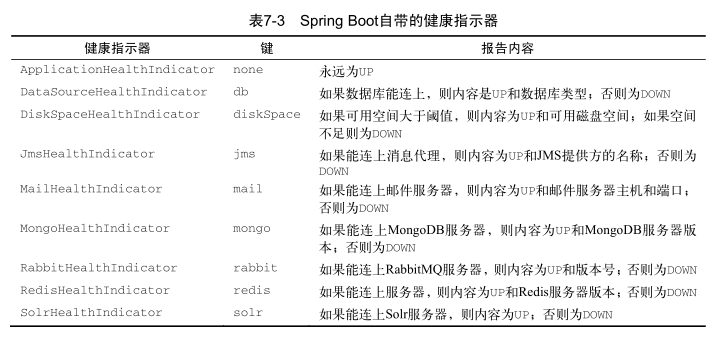
监控应用程序健康情况:/health
如果你想知道自己的应用程序是否在运行,可以直接访问/health端点。
$ curl 'http://localhost:8080/health'
{"status":"UP","diskSpace":{"status":"UP","total":254553292800,"free":141066600448,"threshold":10485760}}
/health端点所提供的所有信息都是由一个或多个健康指示器提供的。
关闭应用程序:/shutdown
为了关闭应用程序,你要往/shutdown发送一个 POST 请求。
$ curl -X POST 'http://localhost:8080/shutdown'
{"message":"This endpoint is disabled"}
这个端点默认是关闭的。
要开启该端点,可以将 endpoints.shutdown.enabled 设置为 true 。
endpoints:
  shutdown:
    enabled: true
获取应用信息:/info
/info端点能展示各种你希望发布的应用信息。
对该端点的 GET 请求的默认响应是这样的:
$ curl 'http://localhost:8080/info'
{}
可以在application.yml里 可以配置如下属性:
info:
    app:
        name: '@info.app.name@'
        version: '@info.app.version@'
        grailsVersion: '@info.app.grailsVersion@'
/info端点返回的 JSON 会包含一个 app 属性
$ curl 'http://localhost:8080/info'
{"app":{"grailsVersion":"3.3.10","version":"0.1","name":"readinggrails"}}