Arthas 之定位方法调用问题
通过 Arthas 中的 trace/monitor/watch/stack/tt 等命令,可以查看方法内部调用信息,从而定位定位方法调用问题。
示例代码
Spring Boot 启动类 sample.demo.ServerDemoApplication:
@SpringBootApplication
public class ServerDemoApplication {


	public static void main(String[] args) {
		SpringApplication.run(ServerDemoApplication.class, args);
	}

}
控制类 sample.demo.controller.UserController:
@RestController
@Slf4j
public class UserController {

    @Autowired
    private UserService userService;

    @GetMapping(value = "/user")
    public HashMap<String, Object> getUser(Integer uid) throws Exception {
        // 模拟用户查询
        userService.get(uid);
        HashMap<String, Object> hashMap = new HashMap<>();
        hashMap.put("uid", uid);
        hashMap.put("name", "name" + uid);
        log.info(hashMap.toString());
        return hashMap;
    }
}
Service 类:sample.demo.service.UserService:
@Service
@Slf4j
public class UserService {

    public void get(Integer uid) throws Exception {
        check(uid);
        service(uid);
        redis(uid);
        mysql(uid);
    }

    public void service(Integer uid) throws Exception {
        int count = 0;
        for (int i = 0; i < 10; i++) {
            count += i;
        }
        log.info("service  end {}", count);
    }

    public void redis(Integer uid) throws Exception {
        int count = 0;
        for (int i = 0; i < 10000; i++) {
            count += i;
        }
        log.info("redis  end {}", count);
    }

    public void mysql(Integer uid) throws Exception {
        long count = 0;
        for (int i = 0; i < 10000000; i++) {
            count += i;
        }
        log.info("mysql end {}", count);
    }

      public boolean check(Integer uid) throws Exception {
         if (uid == null || uid < 0) {
             log.error("uid不正确,uid:{}", uid);
             throw new Exception("uid不正确");
         }
         return true;
     }
}
trace(内部调用路径)
方法介绍
通过 Arthas 中的 trace 命令,可以查看方法内部调用路径,并输出方法路径上的每个节点上耗时。
官方文档:
https://alibaba.github.io/arthas/trace.html
参数说明
使用 thread --help 获取 thread 命令的帮助信息:
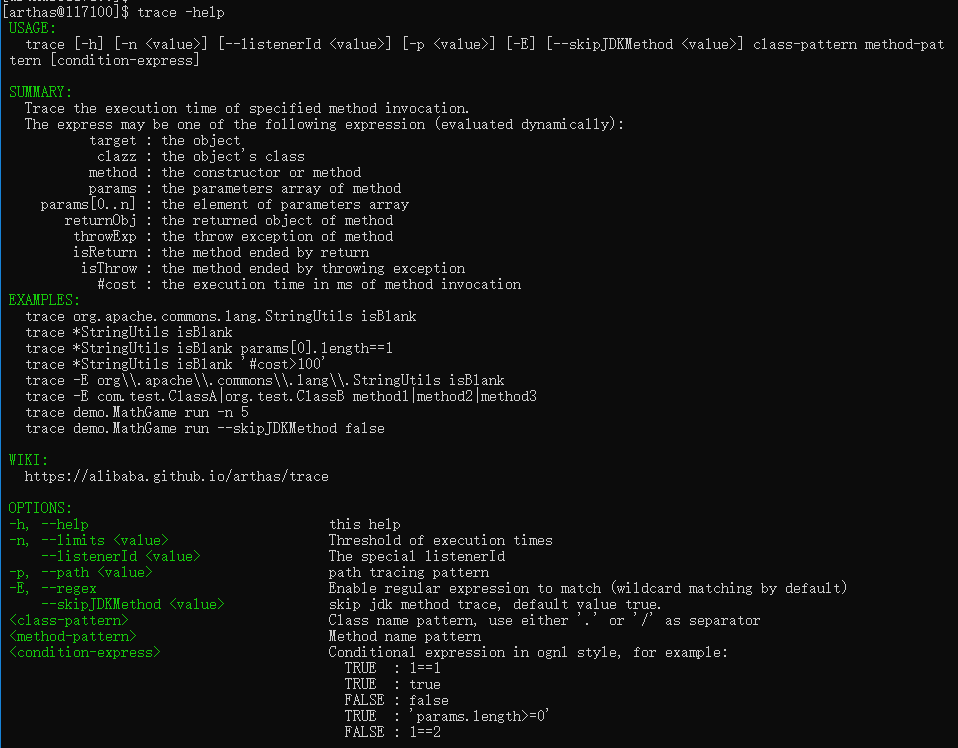
主要参数说明如下:
| 参数名称 | 参数说明 |
|---|---|
| class-pattern | 类名表达式匹配 |
| method-pattern | 方法名表达式匹配 |
| condition-express | 条件表达式 |
| [E] | 开启正则表达式匹配,默认为通配符匹配 |
[n:] |
命令执行次数 |
#cost |
方法执行耗时 |
定位耗时问题
使用 **trace ** 命令开始检测耗时情况。
trace sample.demo.controller.UserController getUser结果如下:
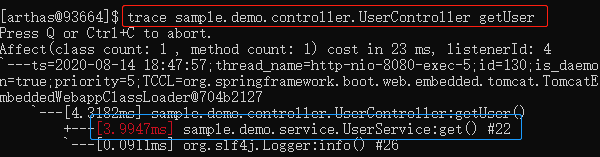
继续跟踪耗时高的方法,然后再次访问。
trace sample.demo.TraceService get结果如下:
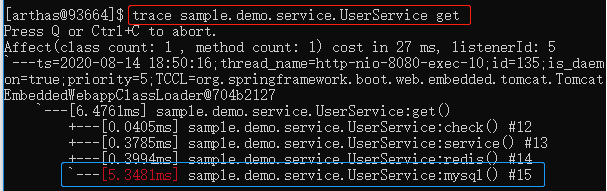
很清楚的看到是 TraceService 的 mysql 方法耗时是最高的。
monitor(方法调用监控)
方法介绍
monitor 命令可以对匹配 class-pattern/method-pattern 的类、方法的调用进行监控。
官方文档:
https://alibaba.github.io/arthas/monitor.html
参数说明
使用 monitor --help 获取 monitor 命令的帮助信息:
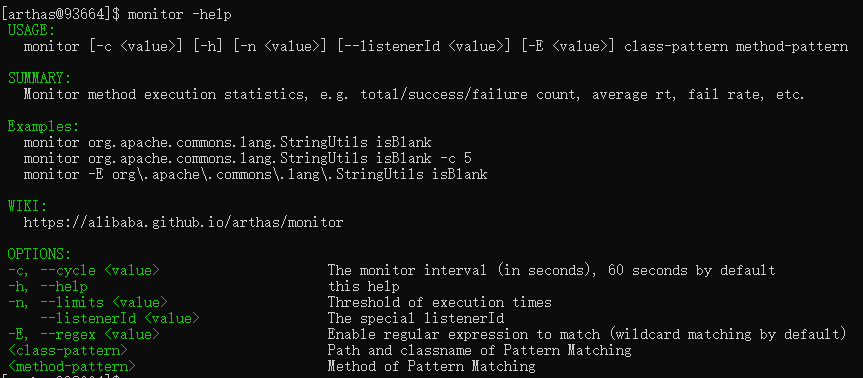
方法拥有一个命名参数 [c:],意思是统计周期(cycle of output),拥有一个整型的参数值
| 参数名称 | 参数说明 |
|---|---|
| class-pattern | 类名表达式匹配 |
| method-pattern | 方法名表达式匹配 |
| [E] | 开启正则表达式匹配,默认为通配符匹配 |
[c:] |
统计周期,默认值为 120 秒 |
监控的维度说明
| 监控项 | 说明 |
|---|---|
| timestamp | 时间戳 |
| class | Java 类 |
| method | 方法(构造方法、普通方法) |
| total | 调用次数 |
| success | 成功次数 |
| fail | 失败次数 |
| rt | 平均 RT |
| fail-rate | 失败率 |
统计方法耗时
使用 monitor 命令监控统计方法的执行情况。
每 10 秒统计一次 com.UserServiceImpl 类的 get 方法执行情况。
monitor -c 10 sample.demo.controller.UserController getUser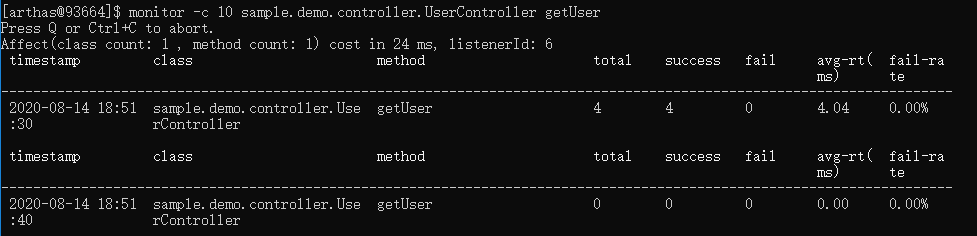
watch(观察方法信息)
方法介绍
watch 让你能方便的观察到指定方法的调用情况。能观察到的范围为:返回值、抛出异常、入参,通过编写 OGNL 表达式进行对应变量的查看。
官方文档:
https://alibaba.github.io/arthas/watch.html
参数说明
使用 watch --help 获取 watch 命令的帮助信息:
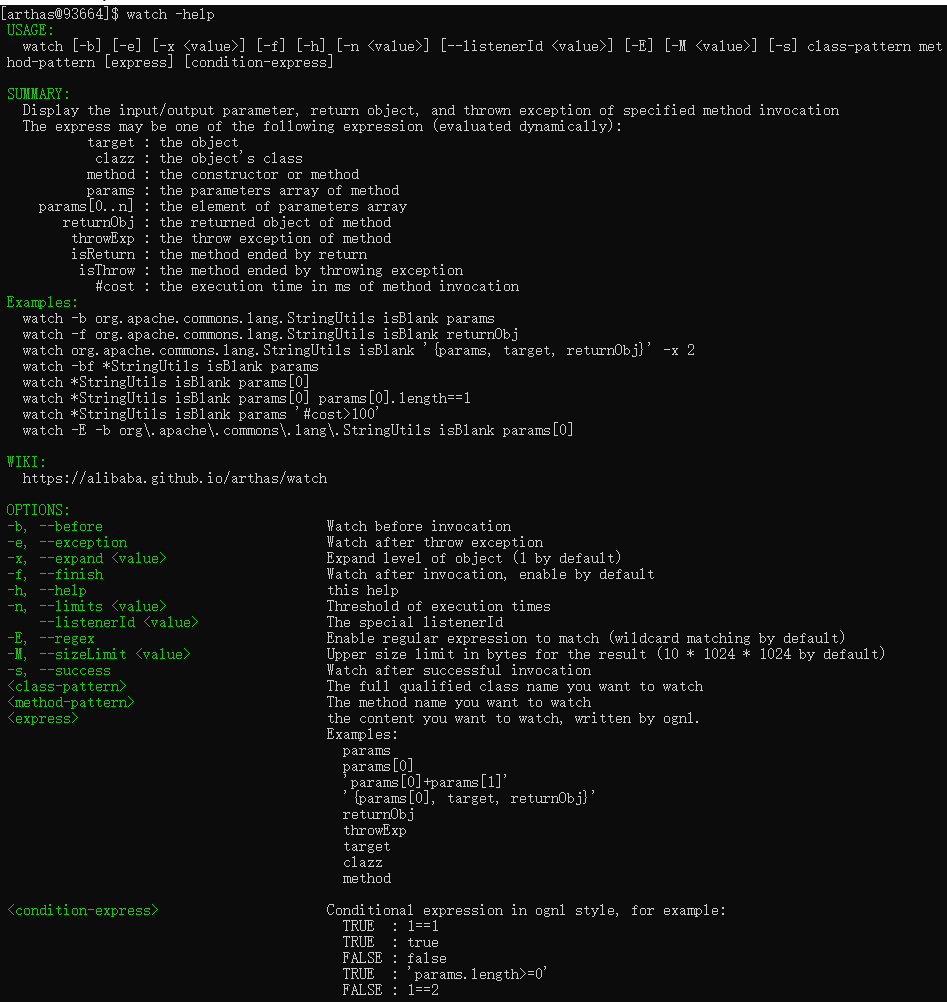
watch 的参数比较多,主要是因为它能在 4 个不同的场景观察对象:
| 参数名称 | 参数说明 |
|---|---|
| class-pattern | 类名表达式匹配 |
| method-pattern | 方法名表达式匹配 |
| express | 观察表达式 |
| condition-express | 条件表达式 |
| [b] | 在方法调用之前观察 |
| [e] | 在方法异常之后观察 |
| [s] | 在方法返回之后观察 |
| [f] | 在方法结束之后 (正常返回和异常返回) 观察【默认】 |
| [E] | 开启正则表达式匹配,默认为通配符匹配 |
| [x:] | 指定输出结果的属性遍历深度,默认为 1 |
观察表达式
观察表达式的构成主要由 ognl 表达式组成,所以你可以这样写 "{params,returnObj}",只要是一个合法的 ognl 表达式,都能被正常支持。
观察的维度也比较多,主要体现在参数 advice 的数据结构上。Advice 参数最主要是封装了通知节点的所有信息。请参考表达式核心变量中关于该节点的描述。
- 特殊用法请参考:https://github.com/alibaba/arthas/issues/71
- OGNL 表达式官网:https://commons.apache.org/proper/commons-ognl/language-guide.html
特别说明
- watch 命令定义了 4 个观察事件点,即
-b方法调用前,-e方法异常后,-s方法返回后,-f方法结束后 - 4 个观察事件点
-b、-e、-s默认关闭,-f默认打开,当指定观察点被打开后,在相应事件点会对观察表达式进行求值并输出 - 这里要注意
方法入参和方法出参的区别,有可能在中间被修改导致前后不一致,除了-b事件点params代表方法入参外,其余事件都代表方法出参 - 当使用
-b时,由于观察事件点是在方法调用前,此时返回值或异常均不存在
观察方法信息
查看入参和出参
$ watch sample.demo.controller.UserController getUser '{params[0],returnObj}'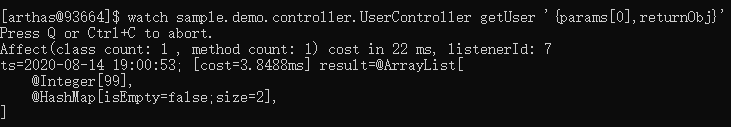
查看入参和出参大小
$ watch sample.demo.controller.UserController getUser '{params[0],returnObj.size}'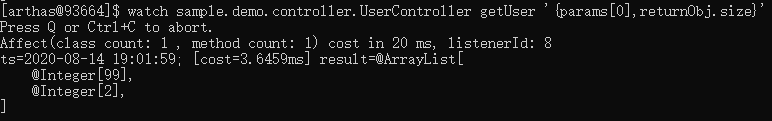
查看入参和出参 String
$ watch sample.demo.controller.UserController getUser '{params[0],returnObj.toString()}'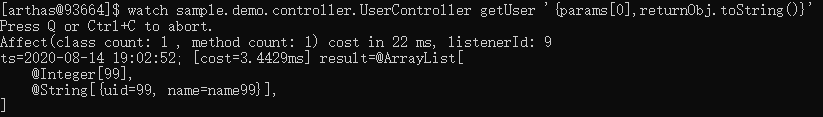
查看方法异常之后
$ watch sample.demo.controller.UserController getUser '{params[0],returnObj}' -e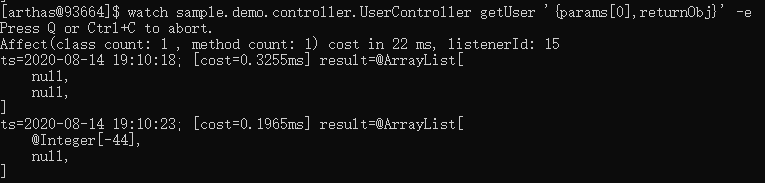
stack(方法调用路径)
方法介绍
stack 输出当前方法被调用的调用路径。
官方文档:https://alibaba.github.io/arthas/stack.html
参数说明
使用 stack --help 获取 stack 命令的帮助信息:
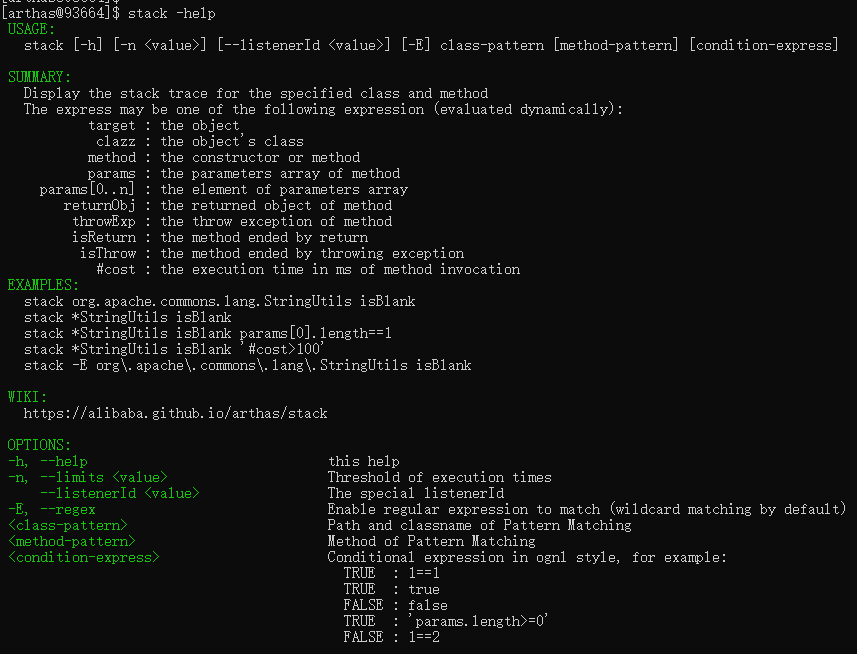
主要参数如下:
| 参数名称 | 参数说明 |
|---|---|
| class-pattern | 类名表达式匹配 |
| method-pattern | 方法名表达式匹配 |
| condition-express | 条件表达式 |
| [E] | 开启正则表达式匹配,默认为通配符匹配 |
[n:] |
执行次数限制 |
方法调用路径
$ stack sample.demo.controller.UserController getUser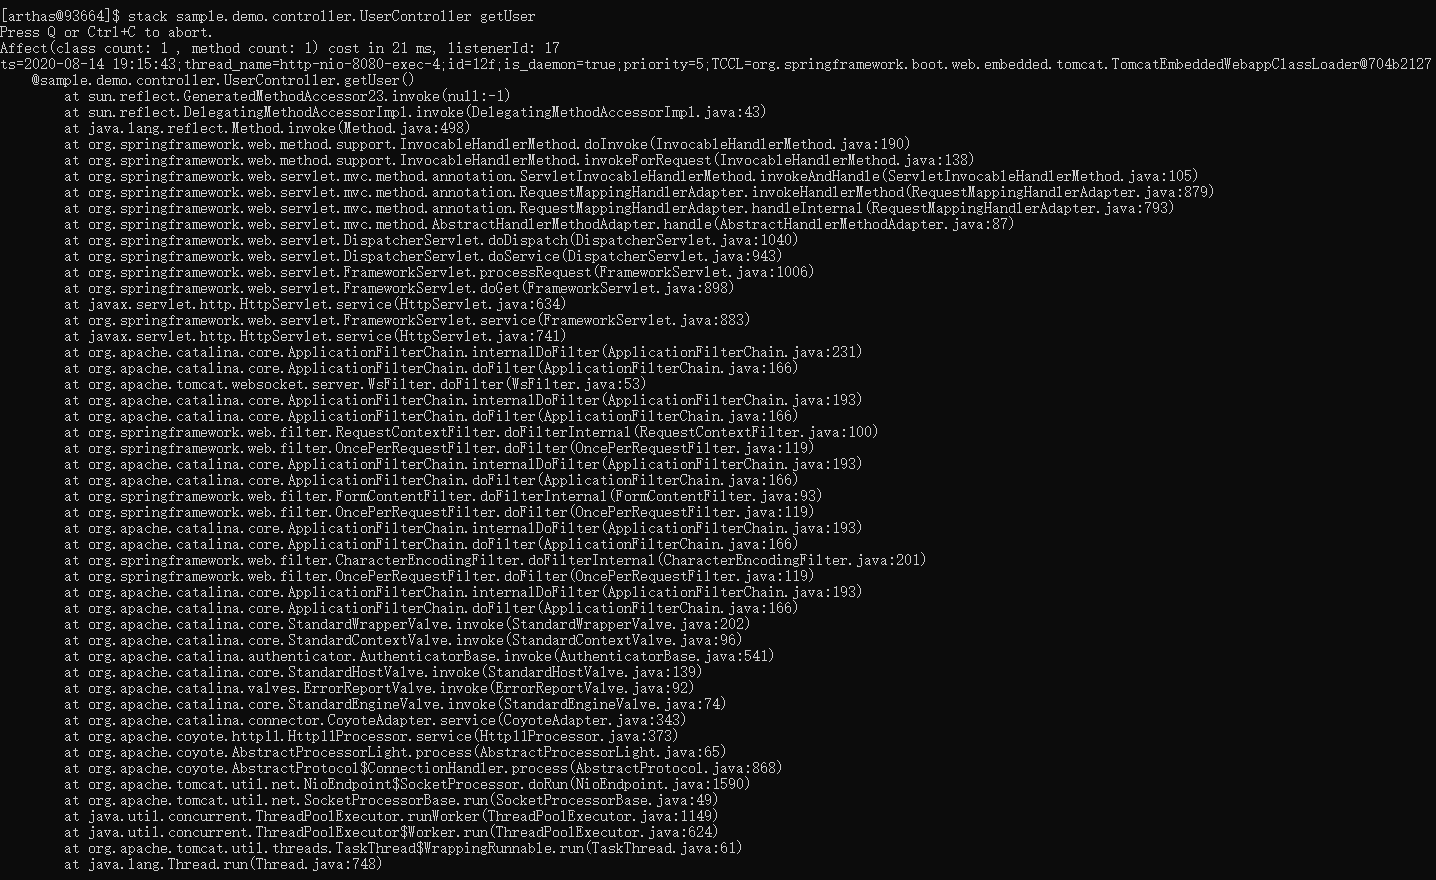
tt(方法调用时空隧道)
方法介绍
tt 方法执行数据的时空隧道,记录下指定方法每次调用的入参和返回信息,并能对这些不同的时间下调用进行观测。
官方文档:https://alibaba.github.io/arthas/tt.html
参数说明
-ttt 命令有很多个主参数,
-t就是其中之一。这个参数的表明希望记录下类*Test的print方法的每次执行情况。-n 3当你执行一个调用量不高的方法时可能你还能有足够的时间用
CTRL+C中断 tt 命令记录的过程,但如果遇到调用量非常大的方法,瞬间就能将你的 JVM 内存撑爆。此时你可以通过
-n参数指定你需要记录的次数,当达到记录次数时 Arthas 会主动中断 tt 命令的记录过程,避免人工操作无法停止的情况。
返回结果说明
| 表格字段 | 字段解释 |
|---|---|
| INDEX | 时间片段记录编号,每一个编号代表着一次调用,后续 tt 还有很多命令都是基于此编号指定记录操作,非常重要。 |
| TIMESTAMP | 方法执行的本机时间,记录了这个时间片段所发生的本机时间 |
| COST(ms) | 方法执行的耗时 |
| IS-RET | 方法是否以正常返回的形式结束 |
| IS-EXP | 方法是否以抛异常的形式结束 |
| OBJECT | 执行对象的 hashCode(),注意,曾经有人误认为是对象在 JVM 中的内存地址,但很遗憾他不是。但他能帮助你简单的标记当前执行方法的类实体 |
| CLASS | 执行的类名 |
| METHOD | 执行的方法名 |
方法调用时空隧道
记录方法调用信息
$ tt -t sample.demo.controller.UserController getUser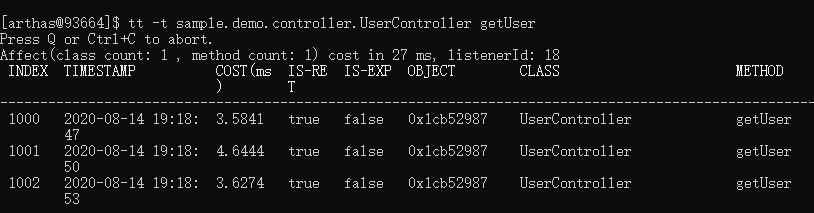
查看记录的调用信息
tt -l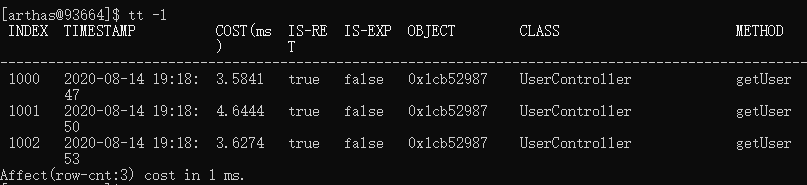
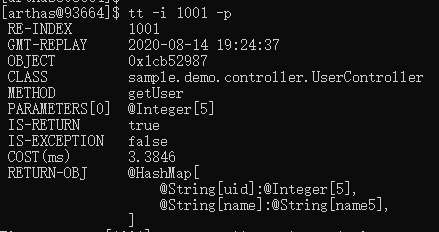
查看记录的详细信息
tt -i 1001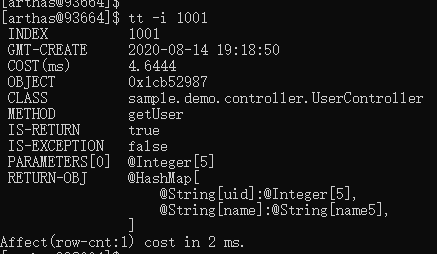
重新发起调用
tt -i 1001 -p